Build the report yourself
Answer revenue and margin questions yourself, in minutes.
Find your own answers!
No more running to a data guy to resolve key questions
How much margin did we actually capture vs what we were eligible for?
Which customers are trending down before we lose the renewal?
Are credit memos eating more of this vendor's margin than last quarter?
Where is fulfillment breaking down by territory, manufacturer, or SKU?
Which products generate the most support cases and credit memos?
Are we sitting on vendor credits that have aged past 60 days?
Any chart, same numbers
Updated live, no matter who is viewing it
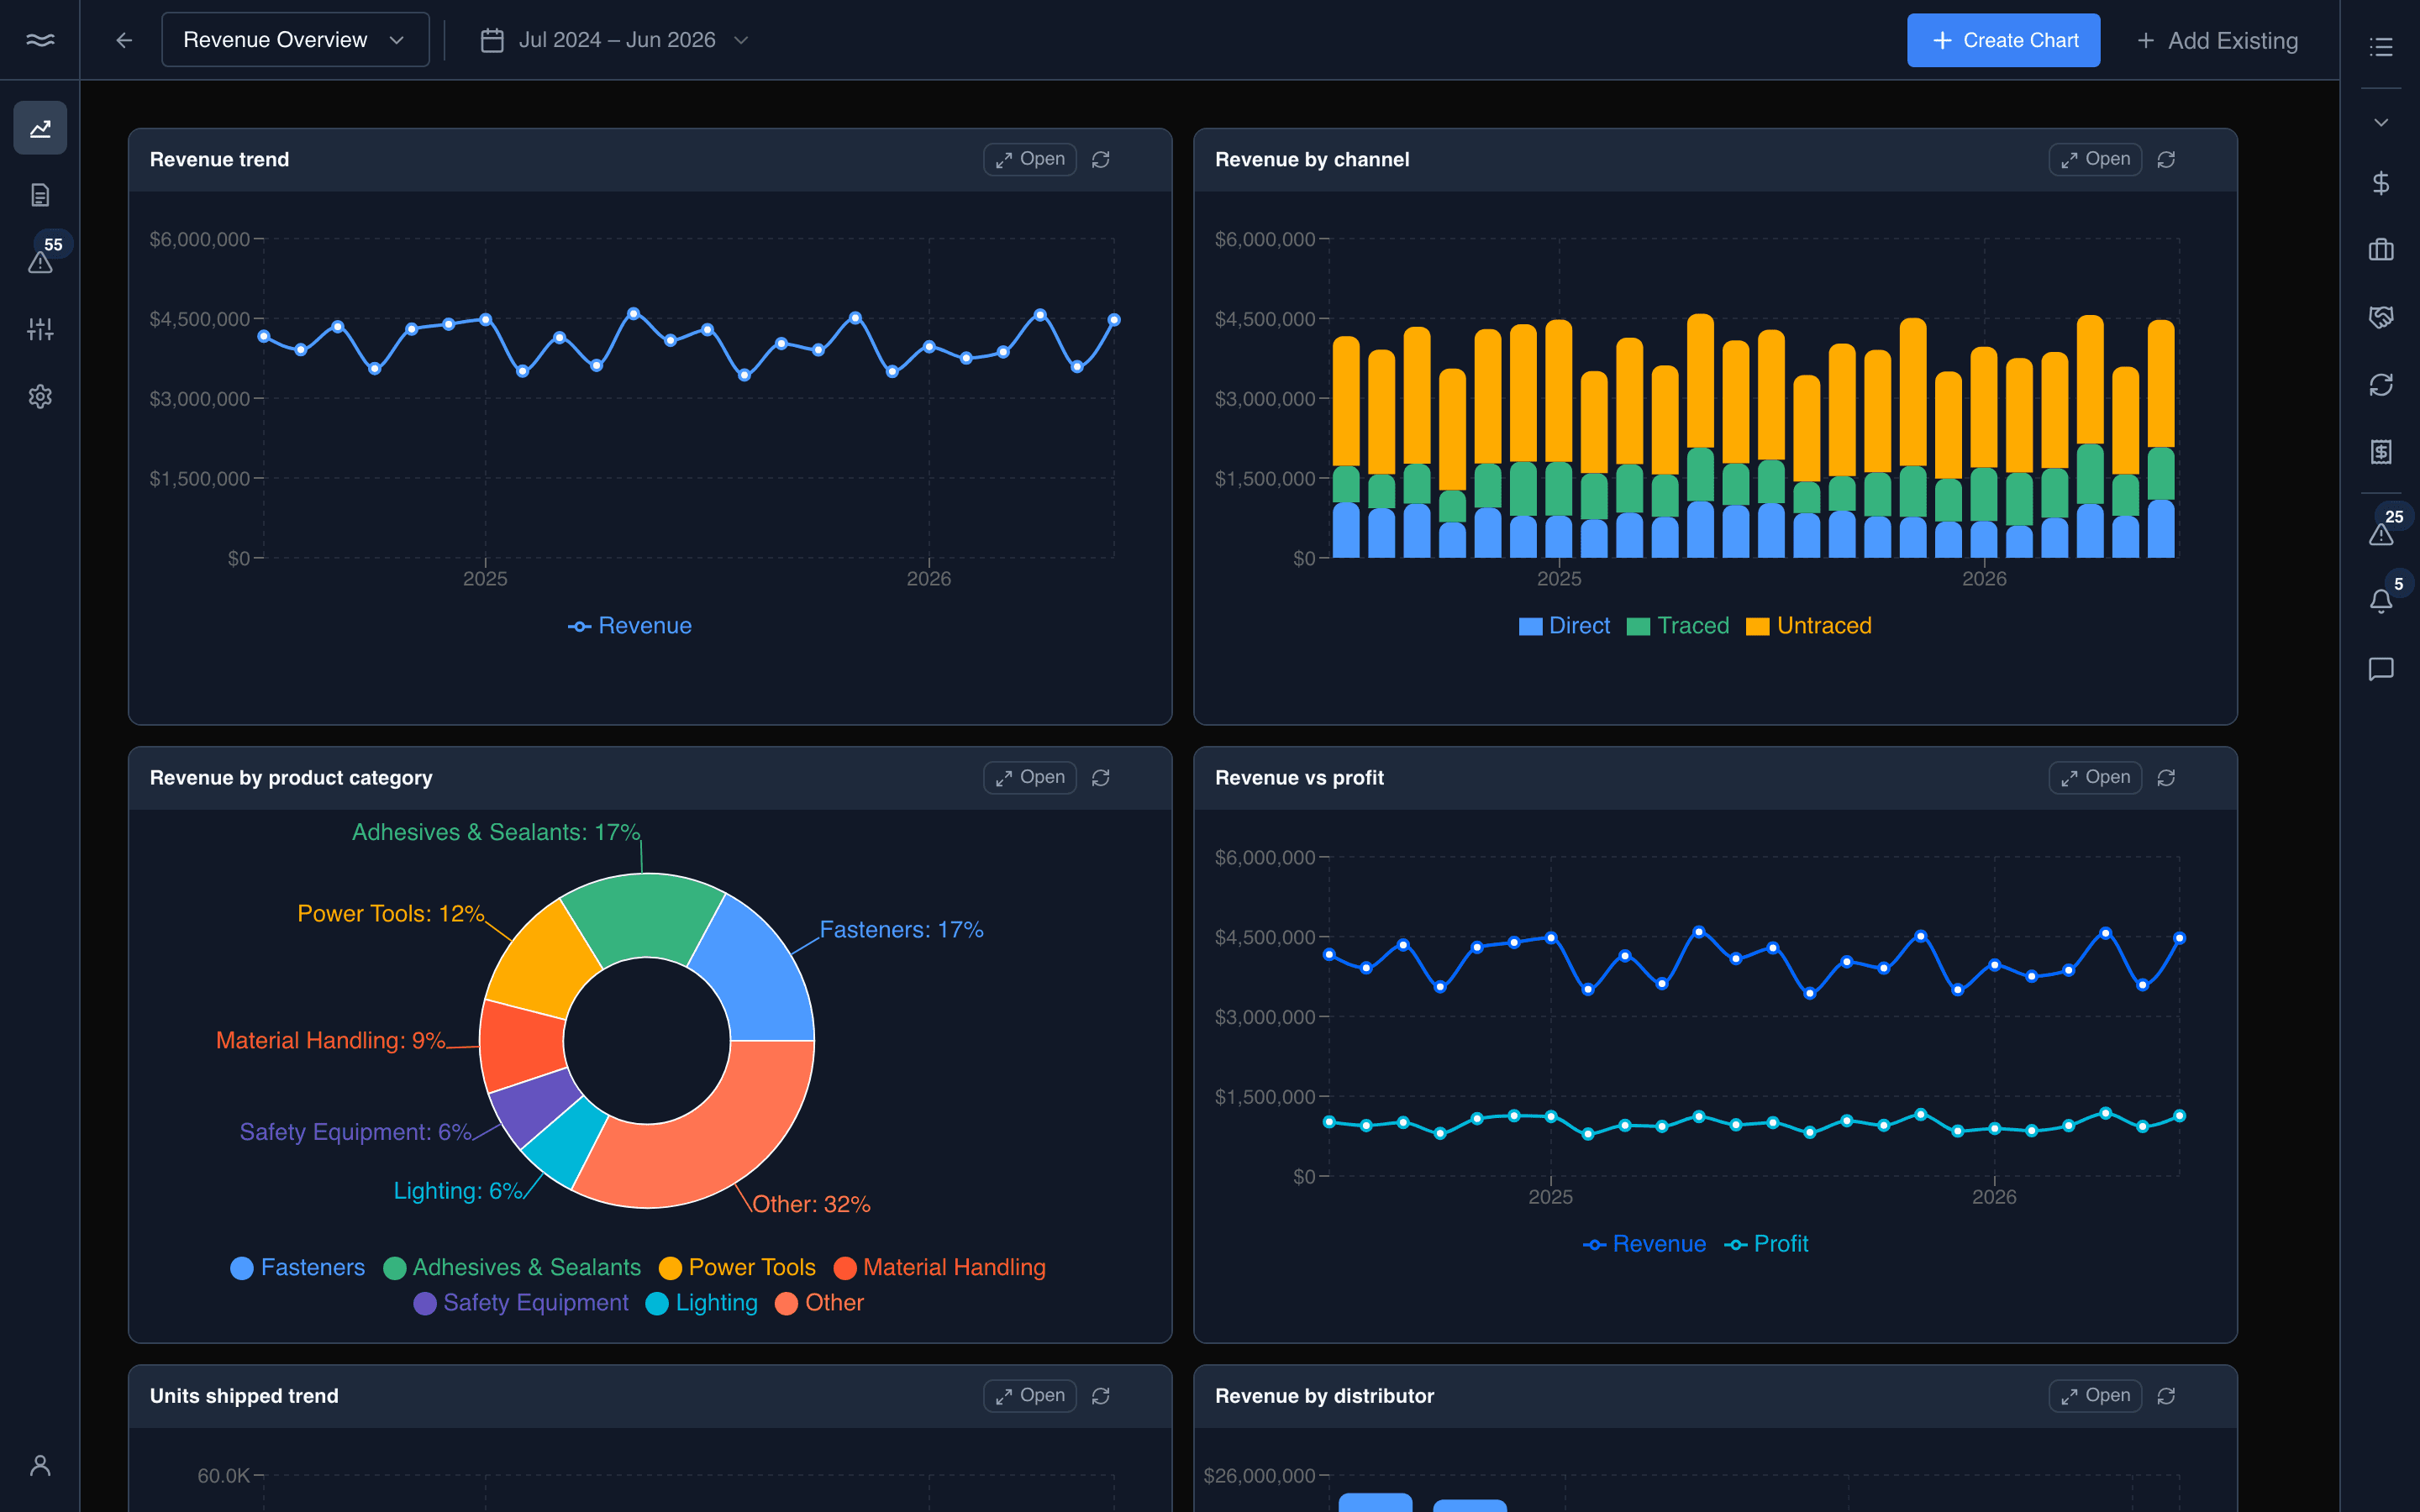
Always current
Decisions made on today's business, not last month's export.
Self-serve
A question raised in the morning is settled by lunch without tickets, or queues.
One definition
Margin means the same thing on every screen, so the debate is about what to do rather than whose number is right.
One set of numbers across the team
Anyone opening a dashboard sees the same date range, the same definition, and the same number.